Yes, we have added a number of sales links to the webpage lately;
since the response to the voluntary donation link has been light, to say the least
(compared to the hundreds of users of this site), "affiliate links" seem to be a reasonable alternative --
you don't pay any more for items or services when you click through from here,
but we get a small commission which helps offset the costs
of maintaining the site and the information it provides to you.
NOTE: Time shown is Mountain Standard Time (USA) * for GMT, add 7 hours.
to those of you who have expressed your thanks, I appreciate that -- in return,
I would like you to find some similar favor you can do for someone else!!
btw, if you have not yet seen the movie "Pay It Forward" I urge you to see it -
then you will understand my concept. If we all help each other, it's "win win" for everyone.
September meeting is via Zoom.
For log-in info, send email to njug@jimcooper.org
Next meeting: SEPTEMBER 8th
Meetings are always the second Thursday of the month.
Computerized Investing group features presentations
and instructions on learning, selecting and using
various charting and technical analysis software.
The object, of course, being profitable investment. We're no longer focusing on just Telechart...
if you are using (or interested in) Tradestation, eSignal,
VectorVest, etc. -- or just in learning how to select and use
charting and technical analysis, come join us !!
The Investment Software User Group of NJ is a
Special Interest Group (SIG) of ACGNJ
We very much appreciate their hosting our meetings each month.
If you would like to be notified via email when updates are made here, just fill in the form below --
NOTICE I have finally completed a project that has been on the "back burner" for a while.
We now have a chart set showing about 17 weeks of charts for each of the
DJ-30 component stocks. This is an "official record" of what EWA predicted
each of those weeks -- so it should give us a good idea of how accurate the
"follow thru" is for the EWA predictions.
So far, I've not gone through the charts to see the results myself.
I'm posting it here since the question came up in a TCnet discussion,
which prompted me to finish the project.
I strongly suggest you download the file - by using 'right click' + 'save target as...' -
and play it from your hard drive rather than from the web.
Every business day, the men and women of the New York Mercantile Exchange stand around in huge circles, shouting at each other, setting the price of the world's commodities. Sound artist Ben Rubin created a layered soundscape of this unusual ritual, known as "open outcry" trading. This piece is part of a work commissioned by Creative Time, a public arts organization, to commemorate the reopening of the Winter Garden of the World Financial Center.
Credit for this goes to "The Next Big Thing" radio program on NPR,
broadcast the week of April 25, 2003.
TCnet info
Graphic files for TCnet "old smiley" faces (.zip format)
Security/virus concerns with
USB memory sticks/drives
[PDF article set]
A V A I L A B L E N O W !
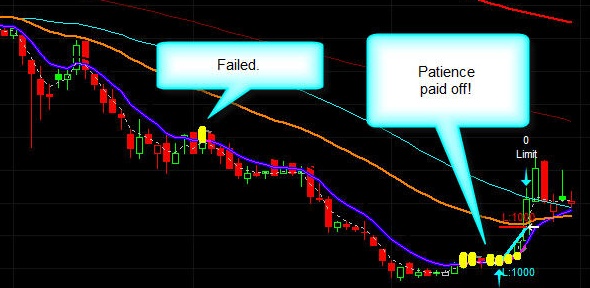
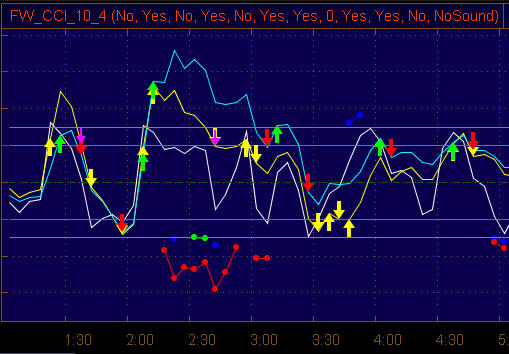
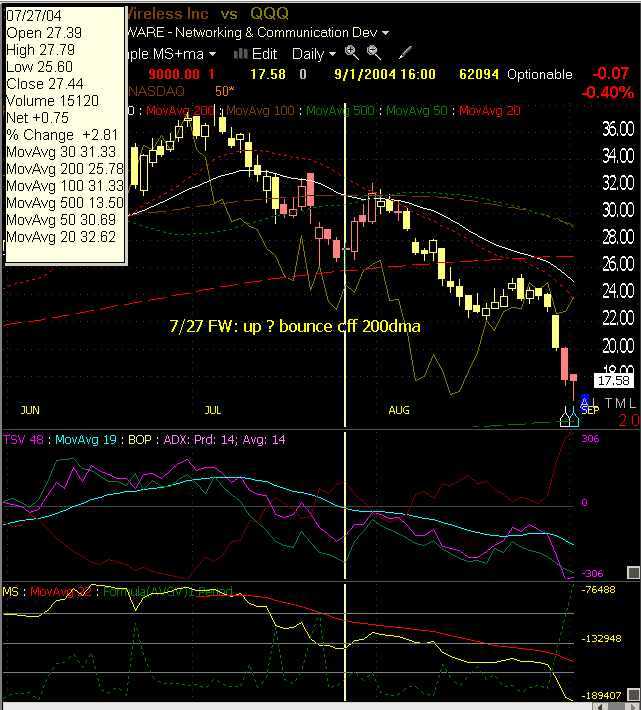
W2JC's "DirCon Panel" --- ---
Shows at a glance --
Moving Average fanouts / crossovers;
Balance of 'up / down volume' for each bar;
For 'tick' and 'volume' bars,
how close the current bar is to being finished;
Real-time value of ATR (Avg. True Range)
Watch the lower right corner of the image -------->
notice especially the blue/orange/yellow dots
and the white dot above the last column!
Click image for a larger view... and basic description.
Click here to receive announcement of release
Click here for detailed description
Click here to watch an hour of real-time action!.
NOTE -- The above indicator system is not related to or associated with either the FirstWave system, the Candlestick Forum or Hit&Run Candlesticks, but could be useful to users of them -- as well as all other traders!
[TM]
CANDLESTICK STUFF
A very unique way of presenting candlesticks [.avi]
Camtasia Player - A simple, standalone video player for .avi files
It is a ZIP file; unzip it into a temporary directory;
then install from there. Simple, easy player made for our files.
.exe
for Candlestick books, charts
& educational material.
CandlestickForum
Learn to Trade the Stock Market - Quick and Easy
with Candlestick Signals. Free "How To" articles, Training aides,
Videos and e-books produced by Stephen W. Bigalow, Author of
"High Profit Candlestick Patterns" and
"Profitable Candlestick Trading"
NEW e-BOOK on "Trading Rules"
is now available... immediate download!
[ Click here for details ]
If you tried before and had a problem with PayPal, try again!
or email me at pinball (at) jimcooper.org
Click logo for freebies, products & services
all their resources and educational material AND webinars.
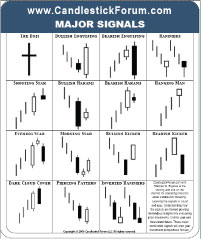
SPECIAL CANDLESTICK FEATURES
Candlestick1 (Steve Bigalow) has given some "primers" on using various candlestick patterns as part of his Forums. I have extracted these primer segments into small files so they can remain here on the site longer.
[ these files play directly from the website - they don't download ]
Cradle pattern sets up after a large down candle, followed by flat consolidation with small candles and then shows a large upside candle.
To order CD training video specifically on Cradles[click]
pages 252-255
INSTANT Gratification:
if you prefer to download the CDs on-line
and save the shipping expense, order here.
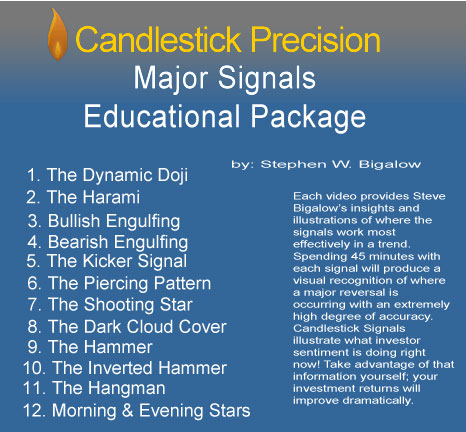
Package of 12 videos - all Major Signals ($581 value)
[ more info ]
Extra SPECIAL Limited Time Super-Bargain ...
all 12 for $12 -- wow!! [download CD]
Five Topic Package for $15 (Limited time offer)
[download CD]
Scanning Techniques
Price Targets
Entry & Exit Points
Stop Loss Strategies
Trading Rules
"Come Into My Trading Room"
Come into Dr. Alex Elder's Trading Room
You are invited to a private Internet class – CURRENT MARKETS WITH DR. ELDER
.
Come into his trading room where he analyzes current markets –
indexes, stocks and futures.
Watch him go through his decision-making process, ask questions,
bring up your favorite stocks or watch the stock picks of
other group members.
Become a better trader by learning from a professional trader.
Dr. Elder has for years offered the Traders' Camp
for traders who have read and learned from his books
and wanted more details and practice using
the "Trading Room" techniques --
These are 'real time' archives of both the sound and the charts --
they should play directly in your Windows Media Player
or RealPlayer (which I find works best)... please RIGHT CLICK and "Save Target As..."
and save to your hard drive.
WallStreetTeachers.com is not a registered Investment Advisor, or a Broker/Dealer, and does not provide investment advice or recommendations. Subscribers to the Hotcomm.com site, the Yahoo site, and the TCNET "firstwave" club are advised that the information, opinions, and analysis included there are based in good faith on sources believed to be reliable, but no representation or warranty, expressed or implied, is made as to accuracy, completeness, or correctness. Past performance is not necessarily indicative of future performance of stocks posted in the "firstwave" club or `Hotcomm.com' site, or Yahoo site. Neither these postings nor the "Firstwave" chat, "Wallstreetteachers" `Hotcomm.com' site, or yahoo emails, nor any other information provided on our web sites, or through any other communication constitutes a recommendation to buy or sell stocks, or any other investment. Investing involves the risk of loss and readers are urged to consult with their own independent financial advisors with respect to any investment.
By request, here is the link that FirstWave
often refers to for real-time metals and commodity
quotes 24/7 -- http://www.kitco.com
I M P O R T A N T * R E A D T H I S
If you have trouble playing the video file the first time (such as sound but no picture),
just fetch and install the Camtasia video player. [ver 2.1.1 is supposed to work with Vista]
It's quick, free and it works.
For MAC users, we've been told that "a video converter
to use for Mac is Daniusoft Video Converter - you download
the file, drag it to the Converter and bam! you are able to
view the FW chats!" (thanks to "PrayingMantis" on ToS)
Hint:
right-click mouse on the link and select "Save Target As"
to save the file to your hard drive instead of having to stay connected
on the web to listen or browse the charts.
FirstWave has given some "primers" on using various indicators such as the mobo bands
and his new interpretation of using ADX to spot trends and blahs.
I have extracted these primer segments into small files so they can remain here on the site longer.
[ these files play directly from the website - they don't download ]
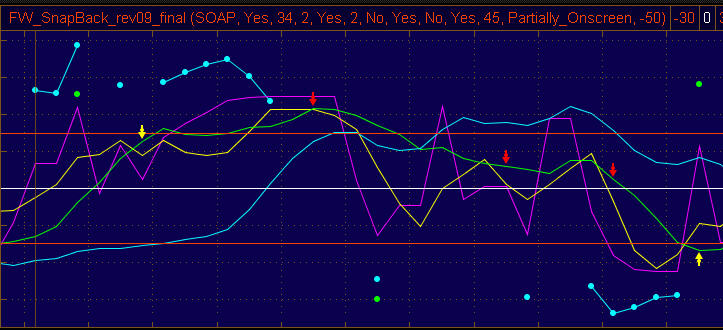
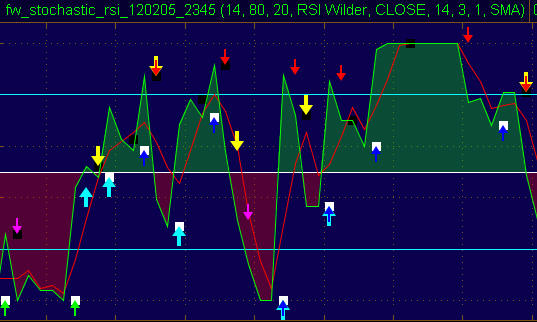
SOAP (Served On A Platter)
The SOAP pattern identifies the high probability of price tops and bottoms on any time period. It is useful in eliminating false buy and sell signals. This concept takes a short-term and medium-term Stochastic, strips off the SD from each of the SKs, and then re-combines the two SK stochastics to give us pure stochastic crossovers.
FirstWave Slide Presentation on SOAP • October 28, 2003 evening (1 MB)
You will need Windows Powerpoint Viewer to open the file - click here to download it.
(this is the free Microsoft viewer - good for Windows 98 and later)
Learn to COUNT WAVES -- can you count from one to three??
NOTE: Tradestation users may be interested in my TOTALY NEW
and SUPER EASY TO USE combination of the ADX and ±DMI indicators
described HERE !
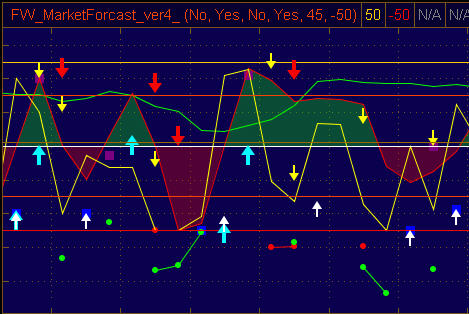
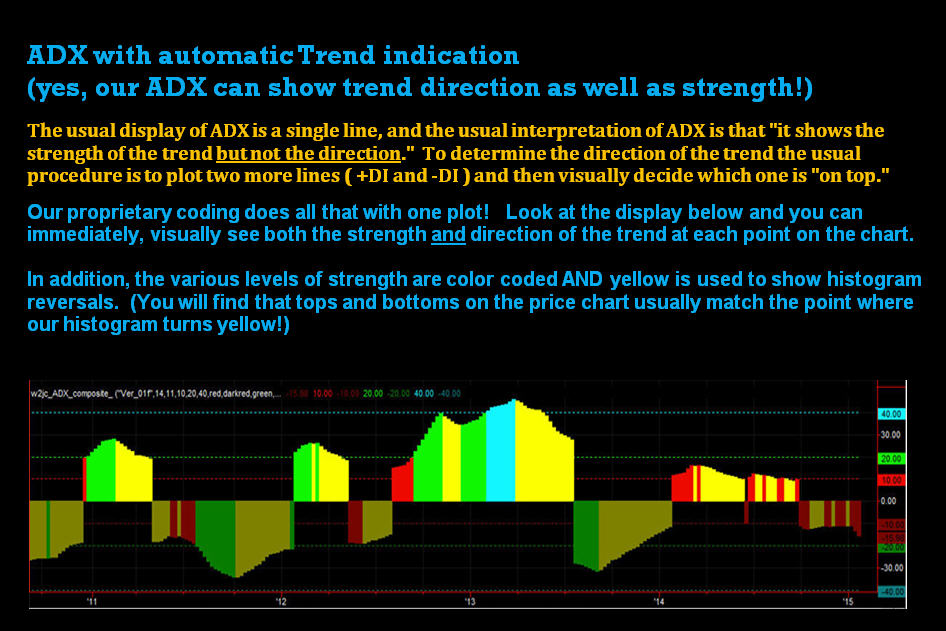
New ADX (Advance Decline Crossover)
ADX can be employed to evaluate the strength of a trend, be it up or down. In conjunction with David Elliott's Technical Timing Patterns™ such as SOAP and SnapBacks, ADX can reveal the strength of buy and sell signals that indicate the timing of explosive market moves.
For a TOTALLY different presentation of ADX,
visit CLICK HERE
Unique use of DMI indicators
A short tutorial on using the +DMI & –DMI in ways that
most people would not think of !! [15 min. video]
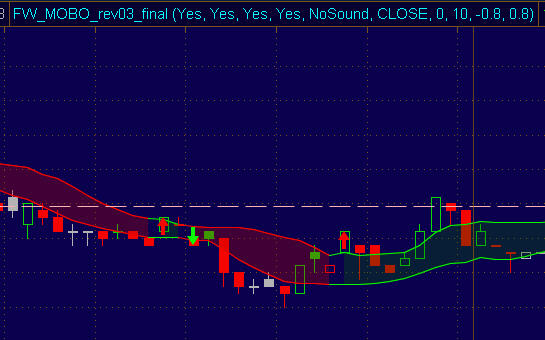
Primer on MOBO bands (March 17, 2009) [197 MB .mp4]
Secondary primer on MOBO bands.
MOBO (Momentum Breakouts)
Price momentum breakouts give us buy and sell signals.
We get buy and sell signals from price Momentum Breakouts by modifying a standard deviation study to show us when "A" stocks breakout to the upside and when "F" stocks breakout to the down side.
We can also adapt the MOBO settings to other technical indicators for entry and exit signals on any time period.
[see a chart with nice MOBO pattern]
FirstWave Slide Presentation on MOBO • October 14, 2003 evening (1.5 MB)
You will need Windows Powerpoint Viewer to open the file - click here to download it.
(this is the free Microsoft viewer - good for Windows 98 and later)
We have no primer on MAPP patterns.
MAP (Moving Average Price Patterns)
Predictable price behaviors occur around the four major moving averages.
On May 26th, 1896 Charles Dow introduced the industrial average, the Dow Jones 30. Since then there has been a repeatable and predictable price behavior pattern around the four major moving averages and this index. We do away with moving average crossovers, and switch to using a behavioral price pattern to find entry and exit prices, while investing in stock, futures, and indexes on all time periods.
[see a chart with nice "Ice Hole Failure" pattern]
We have no primer on FLAT wave patterns.
Elliott Flat Waves
The indicator that gives you tomorrow's Wall Street Journal today!
This technical indicator has been modified to short term TSV (time segmented volume) time periods to give us waves with flat tops and bottoms, indicating a price reversal on the next time period we are using. We can use this indicator intra-day or for long term directional turns.
These are 'real time' archives of both the sound and the charts synchronized -- it should play directly in your Windows Media Player... please RIGHT CLICK and "Save Target As..." to save to your hard drive.
First Wave's Chat • June 28th, 2005 (8 MB .avi)
SPECIAL OPTIONS SESSION with A.J. Monte
[how open option interest can show target stock price]
First Wave's Chat • June 13th, 2005 (11 MB .avi)
SPECIAL OPTIONS SESSION with A.J. Monte
Special Guest = Walter BRESSERT
speaking on Cycle Analysis First Wave's Chat • June 7th, 2005 (14.5 MB .avi)
[note: yes, this appears to stop suddenly at the end -- the sound from the server dropped.]
First Wave's Chat • May 18th, 2005 evening Featuring A.J.Monte, discussing Calendar Spread Options Trading
(14 MB .avi)
First Wave's Chat • Feb 28th, 2005 evening Featuring A.J.Monte, discussing Intro to Options Trading
(28 MB .avi)
Special GUEST today = Candlestick1 First Wave's Chat • Feb 1st, 2005 evening
NOTE: Candlestick1 has a chart and teaching session (voice & charts)
every Thursday that is open to "the public" (not just subscribers to their website);
on Monday's he does special sessions just for their subscribers.
You can join the open Thursday forums by visiting here.
Here's an excellent tutorial on the Elliott Wave principles.
Hotto Club info
Hotto Charts&Chat Archives
Hotto "Bottoming Patterns" presentation by Tina • July 02, 2005 saturday (2 MB pdf)
[This is a PDF document with text and charts plus explanatory notes.]
Hotto Charts&Chat presentation log • December 20, 2003 saturday (6.5 MB zip)
You will need WinZip 8.1 to open the zip file - click here to download it.
PDF with graphics and text of Hotto/ILoveMusic presentation 030524.
Hint:
right-click mouse on the link and select "Save Target As"
to save the file to your hard drive instead of having to stay connected
on the web to listen or browse the charts.
If you have trouble playing the videos,
download the following:
Camtasia Player - A simple, standalone video player for Windows.
It is a ZIP file; unzip it into a temporary directory;
then install from there. Simple, easy player made for our files.
Other interesting stuff
right click mouse on the link and select "Save Target to Disk" to download file to your drive for better playback


